
Using Excel to compare changes to "base line"
![]()
This Excel tutorial uses Excel V16. Check the supported versions of Excel here.
This tutorial demonstrates a method for displaying "base line" data. and then overlaying it with the new data, to graphically illustrate the comparative result of changes. It will display a fixed "base line" bump steer curve, and a dynamic "current" bump steer curve as changes are made to the rack location.
This tutorial uses the SRD912 demo file, but you can use your own data.
Start SusProg3D, and open the demo file, SRD912.s3d
If the number of calculated data points is greater than the Excel range, then all Excel cells will be blank, so make sure that the Excel range size matches the Roll&Bump calculation range.
Go to the Tools tab, and then Calc2Excel. This will open the "Export calculated data to Excel" dialog.
The required number of cells is shown in the "Export calculated data to Excel" dialog. For the bump steer graph we only need the Front bump and
droop data points. Note the number of points.
This tutorial assumes 11 data points in bump and droop. If you have more data
points, then increase the range of cells by the appropriate number in the
following instructions.
For example, if you have 21 data points then A12 will become A22, B12 will
become B22, etc.
We will assume that you have completed the Using Excel to graph Susprog3D data tutorial.
In the previous tutorial, we opened Excel and used the default Book1 and Sheet1. This time we will create and name the spreadsheet, and then open and connect to it from SusProg3D.
Start Excel, and open a new Workbook (if there is not one already open).
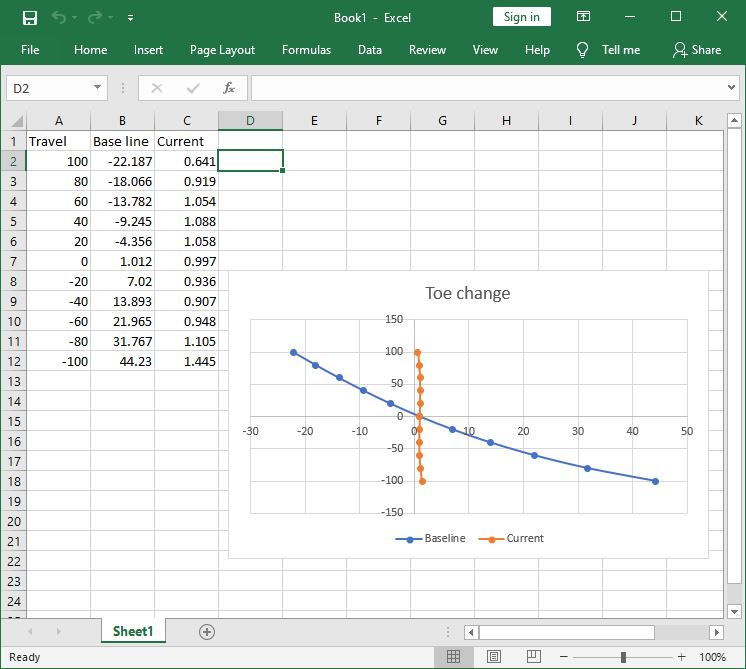
Add some text to cell A1, "Travel", B1 "Base line" and C1 "Current"
This tutorial assumes 11 data points in bump and droop. If you have more data
points, then increase the range of cells by the appropriate number in the
following instructions.
For example, if you have 21 data points then A12 will become A22, B12 will
become B22, etc.
Select the block of 11 cells A2 to A12. Then go to Formulas -> Define Name
or just use Ctrl + F3.
Name this group S3D_B_Point_Bump, change the Scope to Sheet1, and then OK.
Repeat with a third block of cells, C2 to C12, and name as S3D_B_Point_ToeIn with Scope
Sheet1
Note that you have not named the block of cells, B2 to B12.
Highlight the cells A2 to C12, then go to Insert -> Charts. Choose the chart type "Scatter" and the subtype "Scatter with smooth lines and data".
The graph will be selected, so you can edit its properties.
Go to Select Data. This will open the Select Data Source dialog.
Under Legend Entries (series) select Series1 and then Edit.
Change the Series name to "Baseline", the Series X Values to Sheet1!$B$2$B$12, and Series
Y Values to Sheet1!$A$2$A$12. Click OK.
Repeat for Series2 changing the Series name to "Current", the Series X Values to
Sheet1!$C$2$C$12, and Series Y Values to Sheet1!$A$2$A$12.
Click OK.
Back in the Select Data Source dialog click OK.
Now Save Excel. If you are using the demo file, save it in the demo location (usually C:\Users\Public\Public Documents) and name it SRD912.xls
Leave Excel open.
Back to SusProg3D. Close and reopen the "Export calculated data to Excel" dialog.
Because Excel was open, SusProg3D will connect to the currently open workbook. If
you had closed Excel before doing the Calc, you will need to use the Open button
to open the required workbook.
Leave it open, don't close the dialog as this is the connection between
SusProg3D and Excel.
Because we didn't append the range names with "LH" or "RH", we will be working with the datum side. The datum is side is the one shown in brackets. Switch it if you prefer the opposite side.
Note also that the datum side is shown.
Don't close the "Export calculated data to Excel" dialog. You can minimize it, just
don't close it.
Go to Roll&Bump. Make sure that you are using [Front], and then do a
Roll&Bump Calc.
Both the Travel and Current cells should have updated. Base line will be blank
(or zero)
Negative values indicate toein, positive values toeout.
All the toe values will be the same because the basic Roll&Bump doesn't include
the steering calculation.
Go to Steer. Make sure that you are using [Fixed]. Go to Rack Location, and
change the steering rack balljoint dimensions. Move the rack end laterally by
about 25mm or 1", and vertically by a similar amount. Then do a Calc.
We will use this as our "evil handling" "base line" data.
Now, back to Excel.
Select the cells C2..C12 (the current data) and copy and paste them to cells
B2..B12 (the base line data). What we want here, is for these cells to contain a
copy of the base line data values, so they will remain constant while the
"current" data changes.

Now, back to SusProg3D.
Our objective is to achieve a zero bump steer, by moving the rack location a small amount at a time, and, by graphing both the "base line" and "current" bump steer curves, be able to graphically communicate the resulting improvement.
Generally, if the bump steer curve is fairly straight, but angled / or \, it
means that the lateral location is OK, but the height needs adjusting.
Conversely, if the bump steer is reasonably vertical, but convex or concave, it
means that the height is OK, but the tie rod length needs adjusting.
For this tutorial, we will adjust the height and length of the rack. The actual
tie rod length will be calculated to maintain the specified static wheel toe
setting.
To interpret the bump curve, you need to know if you have front or rear steer. In other words, is the steering rack in front of the axle centreline (front steer) or behind it (rear steer).
To correct the tie rod length, in effect by shortening or lengthening the steering rack.
| Front steer | If the bump curve is concave (a ")" shape) then this generally means that the tie rod is too short, and is "pulling" the steering arm in and turning the wheel into more toe in. |
| Front steer | If the bump curve is convex (a "(" shape) then this generally means that the tie rod is too long, and is "pushing" the steering arm out and turning the wheel into more toe out. |
| Rear steer | If the bump curve is convex (a "(" shape) then this generally means that the tie rod is too short, and is "pulling" the steering arm in and turning the wheel into more toe out. |
| Rear steer | If the bump curve is concave (a ")" shape) then this generally means that the tie rod is too long, and is "pushing" the steering arm out and turning the wheel into more toe in. |
What we are trying to achieve is a bump steer curve that is fairly straight, but will angle one way or the other. Something like "/" or "\"
Go to Steer. Make sure that you are using [Fixed]. Go to Rack Location.
Change the steering rack balljoint lateral dimension by 5mm or 0.2".
"Apply" then watch the graph as you press "Calc".
If the curve has become "more concave" or "more convex" then the movement was in the wrong direction.
Keep changing the steering rack balljoint lateral dimension, "Apply"ing and "Calc"ing until you get a straight line, or the curve starts to go the opposite way. As you get closer to a straight line, you will need to make smaller adjustments.
To correct the rack height..
| Front steer | If the bump curve is leaning inwards (a "\" shape) then this generally means that the tie rod is too low, and is "pulling" the steering arm in as the wheel bumps and turning the wheel into more toe in. |
| Front steer | If the bump curve is leaning outwards (a "/" shape) then this generally means that the tie rod is too high, and is "pushing" the steering arm out as the wheel bumps and turning the wheel into more toe out. |
| Rear steer | If the bump curve is leaning outwards (a "/" shape) then this generally means that the tie rod is too low, and is "pulling" the steering arm in as the wheel bumps and turning the wheel into more toe out. |
| Rear steer | If the bump curve is leaning inwards (a "\" shape) then this generally means that the tie rod is too high, and is "pushing" the steering arm out as the wheel bumps and turning the wheel into more toe in. |
Go to Steer. Make sure that you are using [Fixed]. Go to Rack Location.
Change the steering rack balljoint vertical dimension by 5mm or 0.2".
"Apply" then watch the graph as you press "Calc".
If the bump curve has become "more angled" then the movement was in the wrong direction.
Keep changing the steering rack balljoint lateral dimension, "Apply"ing and "Calc"ing until you get a vertical straight line, or the curve starts to angle the opposite way. As you get closer to a vertical straight line, you will need to make smaller adjustments.
Here is where we ended up. Not too bad.
Finally, see if SusProg3D can do better.
Go to Steer. Change to [Chassis], and press "Calc".
This tutorial demonstrated achieving a bump steer solution by changing the rack length and position. With SusProg3D you can also do the same by changing the steering arm ball joint position, by using the [Upright] calculation option.
Tutorial developed using Excel V16 and SusProg3D V5.106A on Windows 10 (64-bit) Nov 2020